Returns a small theme that draws a rectangular border around the plot area. Handy for visually separating inset plots from the main plot.
Arguments
- color
Border color. Default "black".
- linewidth
Border line width. Default 1.
- fill
Background fill color. Default "white".
- ...
Passed to
ggplot2::element_rect().
Examples
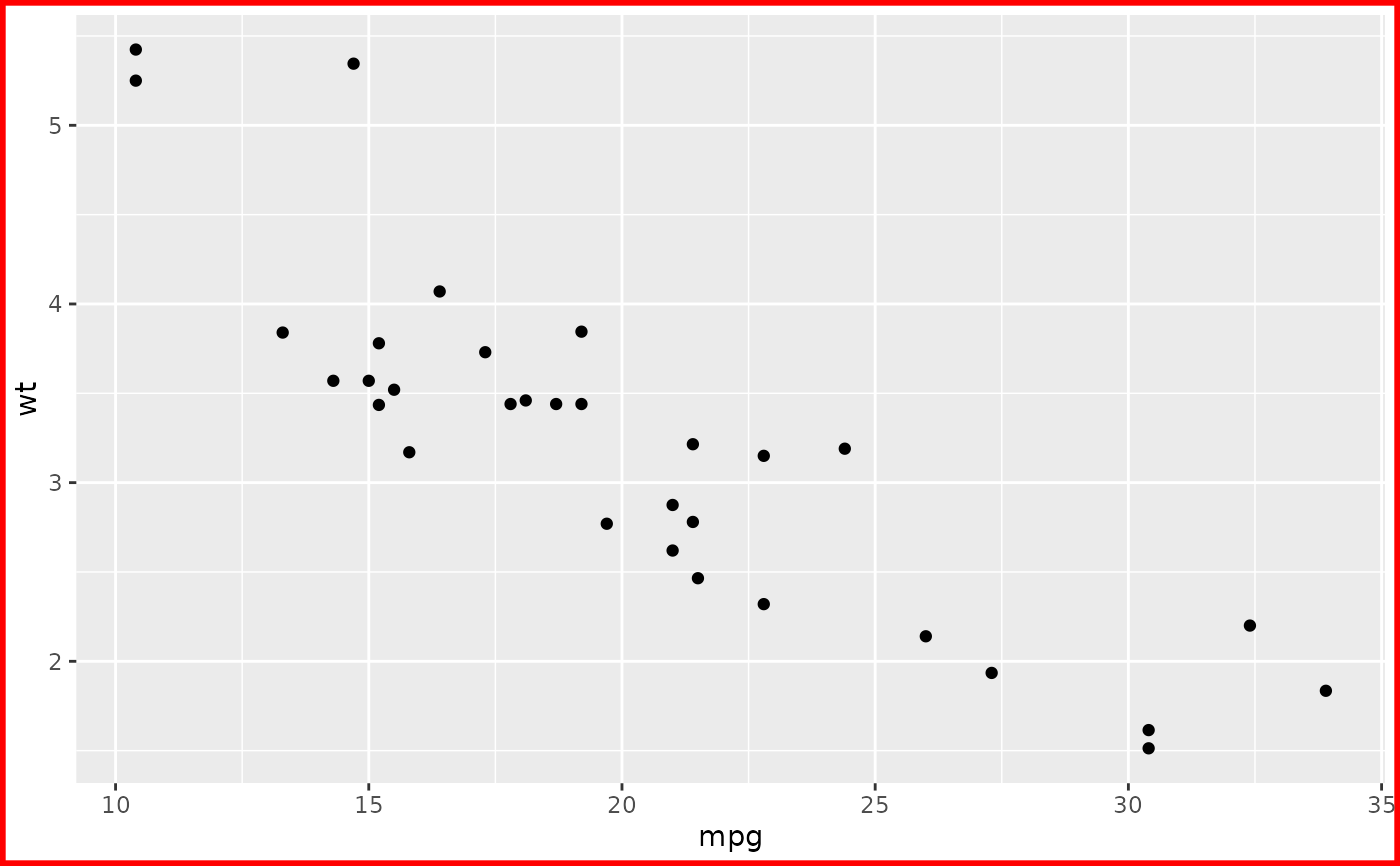
library(ggplot2)

ggplot(mtcars, aes(mpg, wt)) +
    geom_point() +
    map_border(color = "red", linewidth = 2)