Build a combined plot using an inset configuration created by config_insetmap().
For each plot specification in the configuration, the function either uses the
provided spec$plot or the supplied plot parameter and adds spatial coordinates
via ggplot2::coord_sf() with the given bounding box. Non-main subplots receive
a border from map_border(). Insets are composed using patchwork::inset_element().
Usage
with_inset(
  plot = NULL,
  .cfg = last_insetcfg(),
  .as_is = FALSE,
  .return_details = FALSE
)
Arguments
- plot
Optional. Either:
A single ggplot object to use as the base plot for all subplots (unless a spec has its own plot)
A list of ggplot objects matching the length of
.cfg$specs, where each element corresponds to a subplot in the configuration.NULL if all specs have their own plot defined (plot is fully optional in this case)
NOTE: you SHOULD NOT pass
ggplot2::coord_sf()into this plot manually. The coordinate system is handled internally. Default NULL.- .cfg
An inset configuration (class "insetcfg") created by
config_insetmap(). Defaults tolast_insetcfg().- .as_is
Logical. If TRUE, return
plotas-is without creating insets. Useful when debugging or code reuse outside the inset workflow. Default FALSE.- .return_details
Logical. If FALSE (default), returns a combined plot with the main plot and inset layers. If TRUE, returns a list. See 'Value' section for details.
Value
If .return_details = FALSE, a ggplot object containing the main plot plus inset layers. If TRUE, a list with elements:
- full
The combined plot
- subplots
Individual ggplot objects for each subplot
- subplot_layouts
A
listof layout information (x,y,width,height) for each inset- main_ratio
Width-to-height ratio of the main plot's data extent
Examples
library(sf)
library(ggplot2)
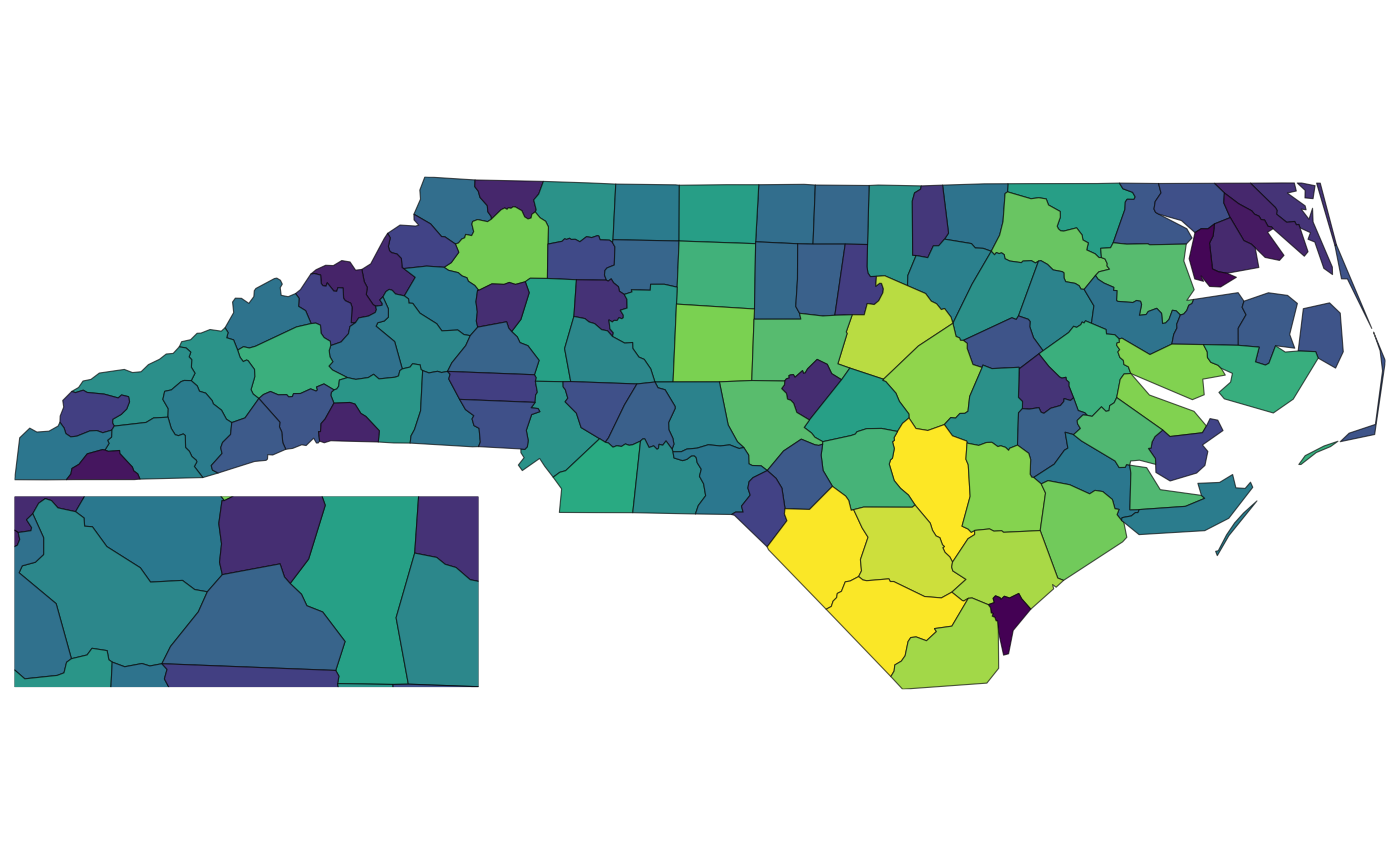
nc <- sf::st_read(system.file("shape/nc.shp", package = "sf"), quiet = TRUE)
config_insetmap(
bbox = st_bbox(nc),
specs = list(
inset_spec(main = TRUE),
inset_spec(
xmin = -82, xmax = -80.5, ymin = 35.5, ymax = 36,
loc = "left bottom", scale_factor = 2
)
)
)
# Supply base plot for all subplots
base <- ggplot(nc, aes(fill = AREA)) +
geom_sf() +
scale_fill_viridis_c() +
guides(fill = "none") +
theme_void()
with_inset(base)
 # Or supply custom plots in each inset_spec, then call with_inset() without plot
config_insetmap(
bbox = st_bbox(nc),
specs = list(
inset_spec(main = TRUE, plot = base),
inset_spec(
xmin = -82, xmax = -80.5, ymin = 35.5, ymax = 36,
loc = "left bottom", scale_factor = 2,
plot = base # Each spec has its own plot
)
)
)
with_inset() # plot parameter is optional now
# Or supply custom plots in each inset_spec, then call with_inset() without plot
config_insetmap(
bbox = st_bbox(nc),
specs = list(
inset_spec(main = TRUE, plot = base),
inset_spec(
xmin = -82, xmax = -80.5, ymin = 35.5, ymax = 36,
loc = "left bottom", scale_factor = 2,
plot = base # Each spec has its own plot
)
)
)
with_inset() # plot parameter is optional now
